

The amount of memory or RAM available on personal computers has increased steadily throughout the past decades. Many factors have pushed an increase in memory usage, and laptops shipping with 8 GB RAM is now a common sight. Yet, those users involved with heavy duty processes, such as game design or video editing, are likely to need more still.
Of course, RAM has its limits. Your system capabilities are limited by the amount of RAM in use, as one of a number of factors. What happens when you have low RAM? Or how about a memory leak? Let’s take a quick look at what RAM is, and what to do when a number of RAM-related issues arise.
RAM, or Random Access Memory, is a vital feature of any computer. RAM is a form of data storage different from your hard-drive. It is volatile and doesn’t maintain storage when the system is powered down. It is called random because you access any memory cell directly, with the memory holding operating system and application specific data needing to be recalled rapidly. While traditional memory has become increasingly fast, it still cannot compare to the latest RAM specifications.
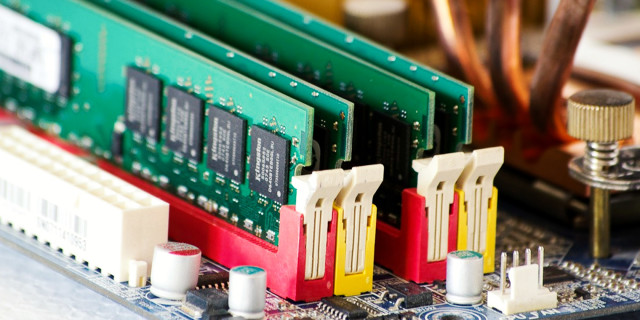
Depending on when your system was built, you likely have 2-8 GB of some variant of DDR SDRAM. Translated, this means Double Data Rate Synchronous RAM, meaning the RAM in your system uses a double data transfer rate by utilizing each up and down tick of the clock cycle (whereas basic RAM only uses one tick, limiting its efficiency).
Every application you open on your device will use a proportion of your available RAM. Some programs are notoriously RAM hungry, like Photoshop or ZBrush. Others will be barely noticeable, like Sizer or Unchecky. Your system performance will be somewhat limited by the amount of RAM available, and the amount of RAM in use. For instance, if you have 4 GB RAM available to your system, but have Photoshop, Microsoft Word, Spotify, and Google Chrome with several tabs open, you’re likely to be pushing the extremities of your system.
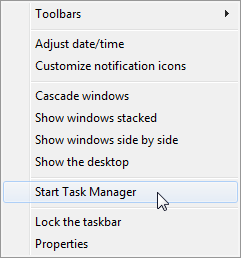
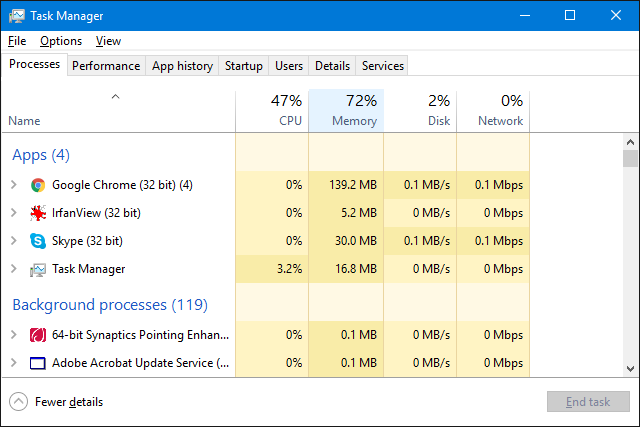
Luckily, a host of programs allow us check what is using our RAM. Right-click the Taskbar. You should spot Start Task Manager. Selecting it will open the Windows Task Manager, which is a control center for your computer. Note the tabs at the top. Click Processes. This will show you each process using the RAM on your system. At the bottom of the panel, Windows handily shows you the cumulative system usage.
At the time of writing this, I’m using 49% of my available 8 GB RAM. My system isn’t slow by any means, but I might close a few of the more RAM hungry processes before playing a game.
Scroll down your own Processes list and look at those currently active. You’ll notice a number of applications you have open, like your Internet browser of choice, your antivirus, or your music player. Alongside those, there are also system critical processes such as svchost.exe, or perhaps your wireless/Ethernet drivers. Unless you know what you’re doing, or have been advised by someone else who does know what they’re doing, don’t mess around with any processes. Unexpectedly ending critical processes can cause your system harm!
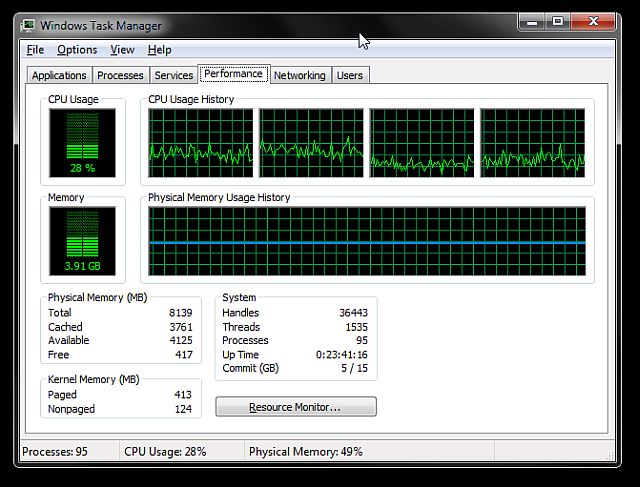
If you then click the Performance tab, you’ll get a system overview. It should look similar to the above screenshot, depending on your version of Windows. As you can see, I am using 3.93 GB RAM, that my system has been up for 23 hours, and that I’m using 28% of my available CPU power.
Not satisfied with the Task Manager? In the Performance tab you can access the more detailed overview of the Resource Manager. The Resource Manager will open in a new window, and initially shows an overview, with separate tabs for your CPU, Memory, Disk, and Network. Head to the Memory tab.
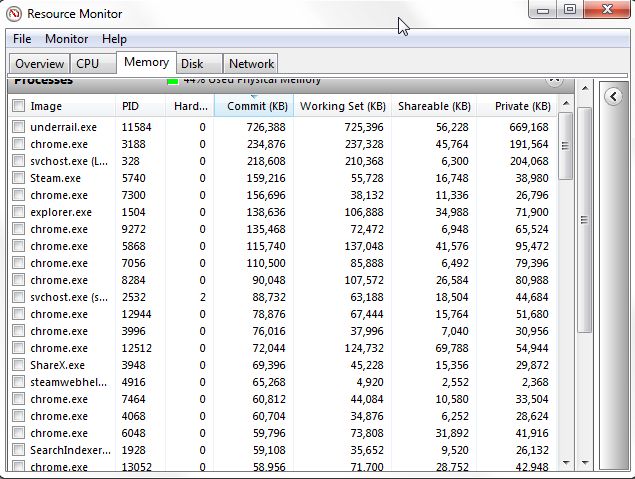
You’ll first notice the delightful bar graph visualizing your current memory usage. There are also some graphs to check out, and the main event of your active memory processes. Your active memory processes show how your RAM is being assigned to make the most use of it. Don’t worry if your bar graph shows no “free” RAM – memory that isn’t being used for something is a waste of resources, so Windows will try to optimize your RAM to make sure it is full of useful, frequently used things.
For instance, you might regularly load a program that uses a common DLL. The application executable and the function may well be sitting in Standby memory, saving time.
Here is an explanation for each of the columns in the Processes panel:
Process Hacker is an open source Task Manager alternative packed with advanced features. If Task Manager and the Resource Monitor don’t quite pack the system management punch you need, give this a try.
Along with the standard features you’d expect, such as graphs for CPU, memory, and disk usage, Process Hacker gives you more control over system processes. For instance, Process Hacker allows you to discover which processes are using a particular file before you attempt to delete or edit it, or create and manage your own system processes.
For a list of tools, check out these Task Manager alternatives, compiled by our very own Joel Lee.
As fast and efficient as RAM can be, it can also run into some irritating issues. Luckily, most are common, and we can offer you some fixes right here.
This could be due to resource heavy applications hogging all of your available RAM. If this is a regular occurrence, we’d suggest purchasing and installing some more RAM. RAM prices regularly fluctuate, so you might find a deal, and depending on your system type, it can be one of the easiest ways to give your entire device a boost.
If you’re unsure of how to install the RAM once you’ve bought it, YouTube is full of tutorials you can find here. If you are still unsure, try typing in the name of your motherboard + install RAM, or your laptop make and model + install RAM. Unless you’re running a super rare setup, it is highly likely someone has been in your shoes and made a video to help others.
This can mean different things on different systems, and it can also relate to the software you’re using.
For instance, an update to the Mozilla Firefox browser in 2014 suddenly introduced a new memory leak issue for numerous systems. A memory leak is where an application incorrectly manages RAM memory allocations, causing the application to retain unneeded memory, or store objects in the memory that can no longer be reached by the application. In either case, the application can completely drain system memory to the point of crashing. In many cases the issue can be resolved by restarting the application, or by updating the application, if it is a repeat offender.
However, it isn’t just applications that can cause a memory leak. Windows 10 system process ntoskrnl.exe has been identified as a memory leak source, confirmed through several Reddit and Microsoft Community Forum posts. People speculate that this particular type of memory leak is caused by malware transitioning through the Windows 7, 8, or 8.1 to Windows 10 upgrade process.
If you suspect a memory leak is hogging your system resources, you can try this simple monitoring technique using the Task Manager. It isn’t 100% accurate, but might give you some insight. Open the Task Manager, and browse to the Performance tab. Keeping the Task Manager open, one-by-one open your most commonly used applications i.e. open Chrome, and monitor it for an hour or two. If the blue line in the Physical Memory Usage History graph continually rises without you using the system, it could be symptomatic of a memory leak.
Every time you turn your computer on, it runs a Power-on self-test process, detecting any immediate issues with your system hardware. The POST process can, on detection of a non-functional setup, deliver error codes as a sequence of flashes, or in many cases, a sequence of beeps. Three short beeps usually indicates a RAM issue, though some motherboard manufacturer use their own beep sequences, so it could be worth checking them out before an issue occurs, or least familiarizing yourself with the model of your system.
If this does occur, and your system fails to boot, it could be something relatively simple, like needing to re-seat your RAM in their respective slots. However, it could also be indicative of something more serious, such as faulty DIMM slots (the bits where the RAM goes!), meaning you’ll need some testing (see below), or potentially a new motherboard.
You’ve installed a new operating system, but it will not register your 16 GB RAM, showing instead 3.75 GB available for use. It could just be you’ve installed a 32-bit version of your operating system, rather than the requisite 64-bit for systems using over 4 GB.
Open the Start menu, search for system, and locate the entry under Control Panel. This screen displays your system information. Check which version of the operating system you’ve installed. If it is 32-bit, you’ll need to reinstall.
![]()
However, all is not lost for those with 32-bit systems, without access or a license for a 64-bit version, who wish to install more RAM. The Windows PAE Patch can allow 32-bit systems to support up to 64 GB RAM. This technique increases the amount of physical address available to the system from 32 to 36, but keeps the system’s virtual addresses the same, ensuring everything still works.
For detailed instructions on how to make this work, refer to our PAE Patch tutorial.
Windows 10 has ongoing issues with RAM usage. No matter the device or Windows 10 version, there have been numerous reports of the operating system decimating system memory with intensive processes. We’ve given Windows 10 its own little section to help you find the issue at hand!
In the earlier section, My System Is Slow, But I Have Lots Of RAM, we looked at memory leaks. Along with the potentially nefarious system process identified there, many users have reported another process using a particularly high amount of system memory: Runtime Broker. Runtime Broker is part of the Universal Apps security subsystem, and essentially all file access and other resources go through the Runtime Broker.
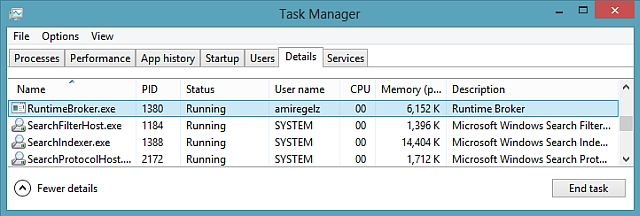
This means all of your Universal Apps from the Windows Store use this service to communicate with your system and other Universal Apps. If you run a large amount of Universal Apps, this service will see a higher-than-expected amount of memory usage. Luckily, Microsoft was aware to the problem and updates KB3081444 and KB3081441 fixed many of the system memory and CPU issues associated with this process.
Put simply, the Superfetch service allows Windows to manage the amount of RAM in the machine it is running on more efficiently. It has been a common service since Windows Vista, and it has two goals: decrease boot time, and make application loading more efficient. This is all very well and good, but it has notable side-effects for gaming processes. However, business related apps such as Excel or Power BI can see performance improvements.
You can disable the Superfetch service if you wish, though I wouldn’t advise doing this unless you are sure of what you are doing.
Disable: Press Win + R to open the Run dialogue. Type msc and press Enter. In the Services window, locate Superfetch. Right-click and select Properties. Select Stop if you wish to stop the service. From Startup Type drop-down menu select Disabled to stop the service resuming at startup.
To re-enable, just follow the instructions above and select Enable in the last step.
Another common occurrence is ever-expanding system resource usage by, well, the system itself. The ballooning effect isn’t a major Windows 10 glitch; it is part of the Matrix itself. Previous to Windows 10, you only had so much space within your RAM to store data. If you filled your RAM, Windows would offload the least used data to the pagefile. Great in practice, but accessing the hard-drive stored pagefile is a much slower process than the ultra-fast RAM.
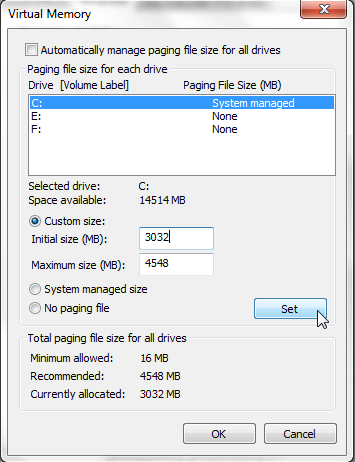
Windows 10 works slightly differently. It still uses the pagefile, but now when your RAM starts to fill up, it can compress old pages of memory to free up space. Meaning, when you leave an application running, but not in use, Windows 10 will make the memory imprint smaller, rather than copying it to the hard-drive. Win win?
Not quite. Decompressing the memory takes up more CPU clock cycles, placing a little bit more strain on performance, though the performance cost is usually vastly reduced versus recalling application-specific data from the hard-drive. Each time Windows 10 compresses a memory page, the system process expands just a little bit.
With this in mind, unless it really is causing your system major issues, it might be best left alone. Unused RAM is wasted RAM, and really the only major fixes for this particular issue is adding more RAM to your system, or managing the applications and browser tabs you have open.
You can choose from a host of dedicated memory diagnostic tools and some inbuilt directly into Windows. Not all tools catch all potential errors, so it can be worth trying a couple to ensure your suspected issue is correctly identified.
Windows features an inbuilt Memory Diagnostic Tool. This will run automatically, if Windows detects a memory issue, but you can also run it independently, if you suspect there is an issue.
Open the Start menu and type memory, then select the Windows Memory Diagnostic. You can choose to immediately restart your system and diagnose, or for the diagnostic to run following the next restart. Be sure to save your work before selecting the immediate restart!
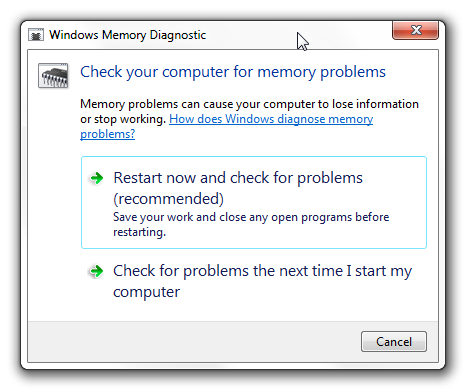
Once the diagnostic tool starts, you can access the advanced tools. Microsoft recommends only advanced users make use of these tools, and the basic scan should be enough for most people. To access the advanced tools press F1 when diagnostic tool runs. You can adjust the following settings:
When you’re ready, press F10 to start the test.
Memtest86+ is an open-source memory failure detection tool. It runs from bootable media to isolate the RAM from your system, making sure no other components or services interfere with the test.
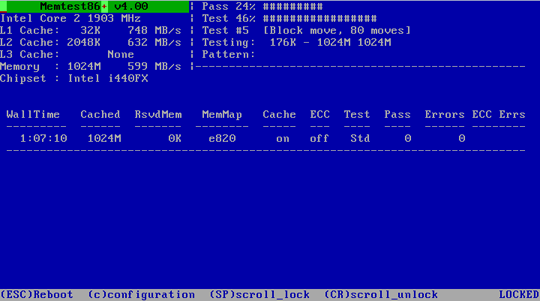
Download Memtest86+ here. You’ll then need to make a bootable USB. If you need a tool to do that, download one via this page. The Bootable USB tools included in that article are all very easy to use. The Memtest86+ developers have included an Auto-installer for USB Key, or you can download a Pre-Compiled Bootable ISO, which is what I’ll be doing.
Once you’ve downloaded the ISO and some Bootable USB software, we can proceed. Open your chosen Bootable USB software, and create a bootable drive using the Memtest86+ ISO. Depending on the software you choose, you may have to unzip/unpack the Memtest86+ ISO, and make sure you set your USB as bootable during the setup!
You’ll now need to boot into your system BIOS. If you’re completely unsure of what is going on here, I would advise seeking further advice, or proceeding with caution. You access the BIOS during the very early stages of the startup procedure. The options usually momentarily flash across your screen, offering you a choice between Enter Bios, Safe Mode, and other motherboard specific options. Still unsure of which button to press? Here is a pretty comprehensive list of BIOS Entry Hot Keys. Obviously, I’ve not tried them all, but I’m sure it is largely accurate.
Make sure your boot order is set to USB, Save and Exit, then reboot your system. It should now boot Memtest86+. It is widely recommended to run Memtest86+ for eight hours, and you should really only test one stick of RAM at a time (if you have multiples) to keep the test isolated. Memtest86+ will continue running until manually stopped, so you can walk away, or leave it overnight. It will display any errors in the main dialogue, and will give you an error type, along with error codes, and the sector the error occurred in. If Memtest86+ runs for eight passes without throwing up an error, there is a very high possibility your RAM is clean.
Again, if you don’t know what you’re doing here, take the information before you to a professional, or exercise some cautious Google-fu to find a potential answer.
We have covered a few issues, some Windows 10 issues, Task Manager, Resource Monitor, and an open source alternative. Hopefully, you’ve identified your RAM issue, or at least have a better understanding of what you might be facing. Otherwise, before panicking about a system on the fritz, run a memory diagnostic tool to check for errors, or monitor your system resources to see where that RAM is disappearing to.
Have we helped? Or are your Windows RAM issues ongoing? Let us know your Windows 10 RAM experiences below!



 How to get Far Cry 4 Infinite Money, More XP and Unlock Special Weapons
 Homeworld Remastered Collection (PC) beginners guide
 Forza 4 Achievements list
 Halo 4 Terminal Locations Video Guide
 Call of Duty Black Ops 2 Guide