Making money in EVE Online can be quite tough, especially when you’re like me and you get a real kick out of blowing stuff up. Recouping losses is inevitable, and it has given rise to a mentality in the community that isn’t unlike the same one shared by the average working person: You do what you do to make money so that you can pursue the things you love.
In EVE, there are a billion and one ways to make a buck. But, if you’re hard on time and enjoy the hands-off approach that allows you to focus on other things—say, creating explosions, then margin trading might just be for you.
Part one of this guide covered the basic mentality of what margin trading is (buying low and selling high), what skills you’ll need to accomplish it effectively, and wrapped up with some ideas of where you can get started.
This week, we’re going to be diving into the tools of the trade, getting you familiar with the regional market window and its various uses, as well as learning to identify healthy items to trade in and items to avoid.
I don’t want to shock you, but if you’re going to be spending some time each day trading you’re going to be seeing the regional market window a lot. Don’t worry, though aspects of it might be confusing, once you get to know your way around things it all becomes a total breeze.
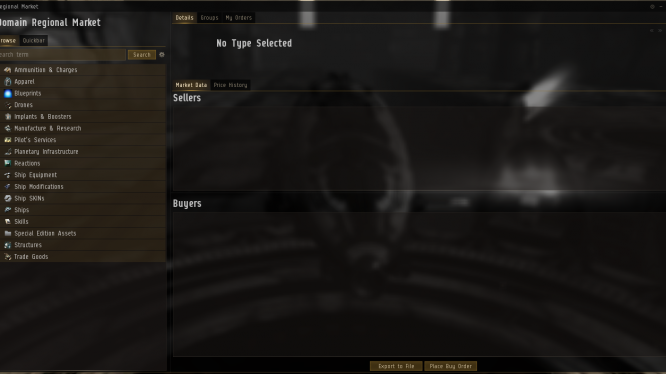
Welcome to your new favorite window, pilot. From here, untold amounts of ISK await you.
The window itself is pretty easy to understand. You have collapsable menus for selling items, a tab above that menu lets you toggle between your quickbar, which acts as a shortcut to items you need easy access to. From there, near the top of the window you can see tabs for Details, Groups, and My Orders. Details will show you the current prices for an item you have selected, while Groups will give you quick access to all the items of a specific group, like all the various damage control units, for example. My Orders will show you all the current market orders you have going, which we’ll discuss another time.
After that, you’re looking at two tabs directly below called Market Data, which shows you pricing on items, and Price History, which is a complicated set of tools that you will eventually use to find good bargains—we’ll cover it later also.
Now, I could regale you with more walkthroughs of the various windows. But that would be terribly boring. Instead, let’s jump right into the process of find a good item to trade, shall we?
You can’t make money if you have nothing to sell, so strategically acquiring assets to make profit margins on is your first order of business. Anything in EVE is worthy of being sold, but some things are much better than others. To help you find what what is good and what is bad we want to take prospective items and pass them through a series of filters.
The biggest key ingredient in being a successful margin trader is in dealing with items that net you a solid profit after being sold, and never dealing in items that are so expensive that you risk losing all your wealth over a bad deal.
Let’s look at Sisters Core Scanner Probes:
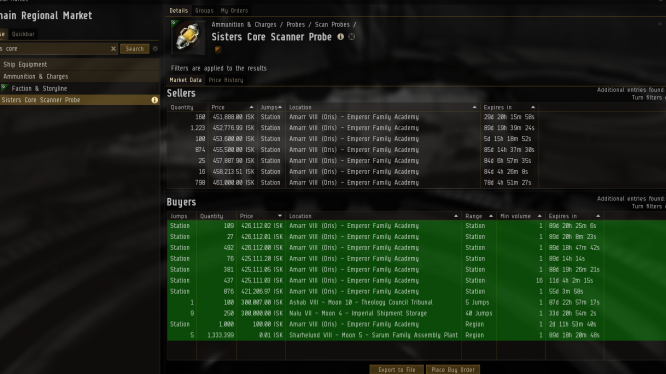
From this window, we can see that the probes sell for roughly 451 thousand ISK, and can be bought for roughly 426 thousand ISK. Profits! But wait, before you set up that buy order asking for a thousand, let’s check a few things out.
By pressing the Price History tab, we can take a look at how healthy Sisters Core Scan Probes are. Let’s take a look:
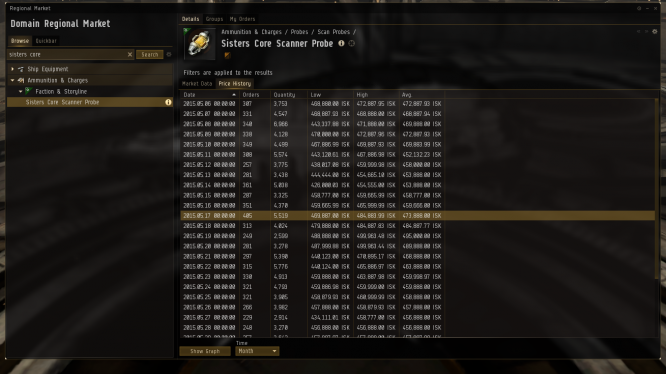
Here we can see a daily total of the item in question. At the bottom of this window we have options to limit that daily total to everything from the past year to the last 5 days. Looking at these numbers might melt your brain. If that’s the case, turn back now ye’ weary pilot, only darkness waits ahead.
Now, the numbers in this table will tell us several things. The low column shows us the lowest price per unit. The High shows the highest price per unit. Using these numbers, we can infer that the lowest is close to the going buying price, while highest is close to the going selling price. The average shows us whether there was more selling or buying happening for Sisters Core Probes. Looking at yesterday’s average, we can see that in fact, this item looks like it is heavily skewed in favor of selling. That’s a red flag.
The biggest takeaway however, is the quantity, which shows us how many units were moved on a given day. Having a high quantity is highly recommended. Good quantity means there is demand for an item, and if you want your money to be working for you, it can’t be sitting in a dead market waiting for someone to buy it.
Let’s take a look at the other super important information we’ll need. Press the Show Graph button next to the drop down box for selecting a time range.
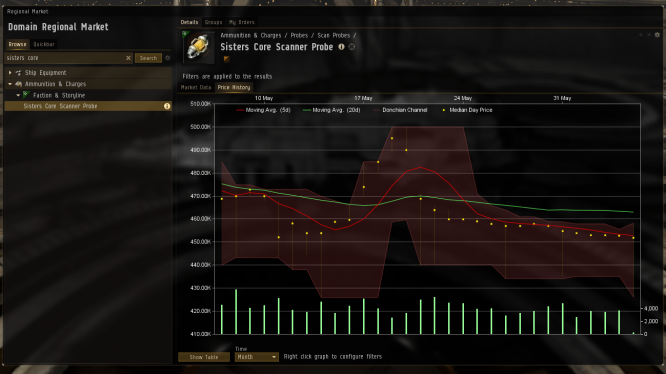
This graph here is likely your most important tool, and while the price history can be useful, getting to know this graph is going to make you a lot of money.
There’s a lot to process here, so lets quickly tally it off:
When selecting an item to trade in, you absolutely want a healthy graph. But Steven, you say, how am I supposed to understand what a healthy graph looks like? The secret is simple: You want shallow curves with a predictable wave, a wide Donchian channel, and a median day price that stays relatively close to the center of the channel.
Let’s take a look at a healthy graph:
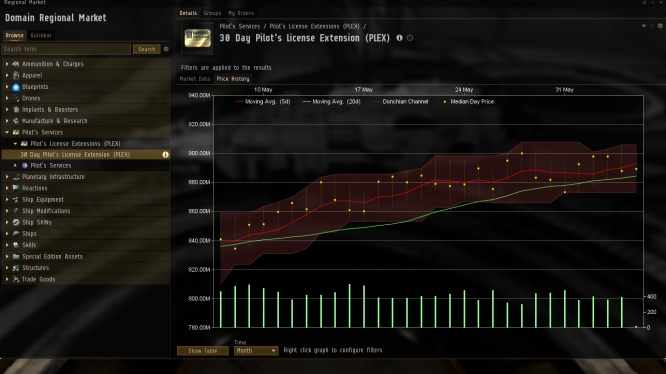
This is a great looking graph—the kind you’d want to take home to show your folks. It should look good, because this is for PLEX, the item you can buy with in-game ISK to cover your 30 day subscription. If it was erratic, EVE Online would be on fire or Iceland would have receded into the ocean.
Here we can see several things:
But before you get ready to buy PLEX, this was only an illustration. PLEX costs an average of 860 million ISK per unit, which, for the average trader, is a bit too high.
Let’s look at an unhealthy graph:
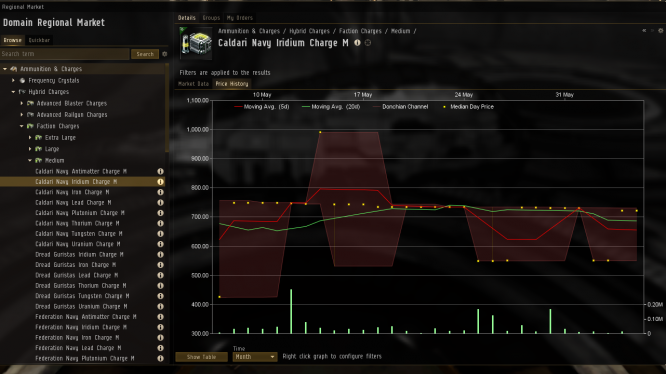
Alright, hopefully by now you can start to pick what’s wrong here. Let’s cover it anyway:
With this knowledge, you can begin picking out items perfect for trading. By spending even 20 minutes on the regional market in your trade hub, you can easily identify 10 or more prospective items to be traded in using this criteria. Look for healthy margins that will represent a steady but stable growth in your net value, and don’t trade in anything that will require you putting up more than 10% of your total ISK. Diversity is king, so spread out that money over as many buy orders as you can and begin acquiring items.
Next time, we’ll tackle how to effectively sell items, some suggestions on where to start based on your level of income, and quick math you can use to help fine tune your investments! Isn’t trading fun?


 Newbie Blogger Initiative 2015 .
 The Witcher 3 Guide: How To Get Elite Crossbow Set DLC, Location And Stats
 Top of the Week: Otherland Beta, Draenor, and More .
 WoW Wednesday: Starting Over Again in World of Warcraft .
 The Games We Played .