Excel is a program that many people are wary of — it’s a complex piece of software, with a lot of functionality hiding away beneath the surface. It’s easy to see why novices would be put off by something so complicated, but this powerful piece of software is well worth the effort.
The key is breaking the learning process down into manageable components. It’s impossible to learn Excel in a day or a week, but if you set your mind to understanding individual processes one by one, you’ll soon find that you have a working knowledge of the software.
Make your way through these techniques, and it won’t be long before you’re comfortable with the fundamentals of Excel. From there, you’re well on your way to becoming a true spreadsheet master.
Here are some of the first techniques you’ll need to master if you want to get to grips with Excel. They’re largely very simple, but it’s important that you’re familiar with them before you start attempting more complex tasks.
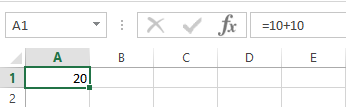
To begin, start with the most basic math problems you will ever need to feed into Excel. The first thing to remember about techniques like this is that Excel expects to see an equals sign first when you’re giving it a problem to work out. Type in =10+10 into a cell in your spreadsheet and press enter; the cell should display the number 20.
Adding and subtracting is fairly self-explanatory, but you’ll need to use an asterisk (*) in place of a multiplication sign and a forward slash (/) in place of a division sign.
If you’re just getting started with Excel, this is a great way to get up to speed with the basic use of Functions. First, enter any two numbers in cells that are next to one another — either side to side or above and below works fine. Next, select the cell directly to the right or below those cells and navigate to Home > AutoSum.
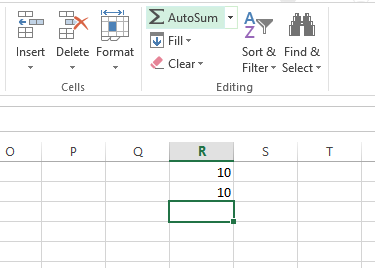
This will automatically populate the selected cell with a SUM formula, so press enter to execute it. Excel will add the two numbers together and deliver the result in the specified cell — by using the AutoSum dropdown, you can choose different mathematical functions, too.
Once your spreadsheets start getting a little bit more complex, they’re liable to contain different types of numbers; currency, dates, percentages, and more. To make sure you can work with this data, it’s well worth formatting it to type.
Select the numbers you want to format — you’ll have to do each different type one at a time. Look for the Number section at the top of the screen, and find the dropdown that defaults to General.
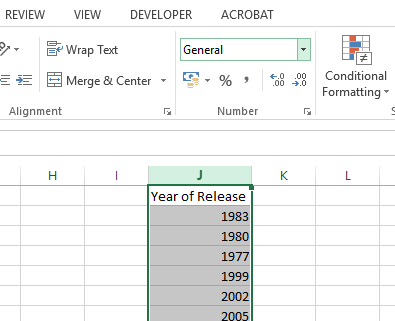
From there you can choose from a healthy list of different number formats. If you’re looking for more control, select More number formats from the bottom of the list, and you’ll be able to specify details like the amount of decimal places to use, or your preferred currency.
Presenting your data as a table allows you to do much more with the information at hand, and it’s very easy to set up. To get started, select the entirety of the data set you’re looking to convert into a table — including headings — and click on the Quick Analysis shortcut that will appear at the bottom left corner of your selection.
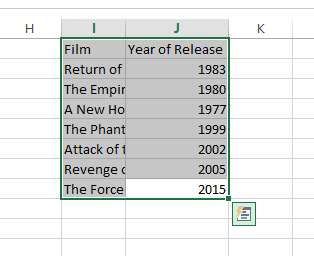
Navigate to the Tables tab and select Table. You’ll notice some immediate differences to the way the data looks, and there are some changes to the way it can be manipulated, too.
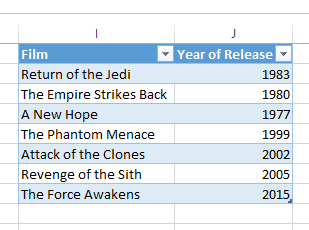
Use the arrow buttons in the table header cells to filter out particular points of data, or sort them one way or another.
You can make a chart or a graph in much the same way that you would create a table — but you’ll need to consider how you want to present that data ahead of time. Excel can give you some pointers, but it’s important to be aware of what you want the chart to achieve. With that in mind, lay out your data and select the whole thing, just as you did when creating a table.
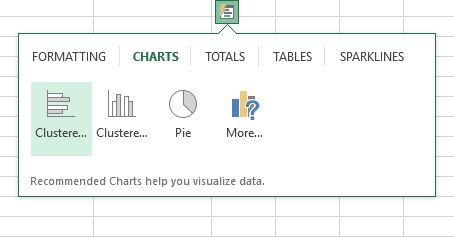
Hover over one of the options to get a preview of how it will look, or select More for extra control over the finished product.
Sooner or later, you will probably want to take your Excel usage to the next level. The good news is that many aspects of the software’s functionality are connected in some way or another, meaning that learning one technique will likely reap benefits elsewhere later on.
Once you’ve mastered basic arithmetic in Excel, it’s wise to start experimenting with Functions. You’ll discover a huge variety of different Functions to carry out different procedures, and all are slightly different — however, working with simpler examples will help you become familiar with basic practices that carry over.
Let’s get started by using one of the most basic Functions included in Excel, SUM. We can use this functionality to add up a series of figures without doing the legwork ourselves.
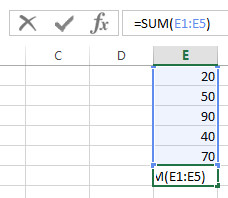
As you can see above, I have five numbers that I’d like to add together, so I’ve entered my Function in the cell directly below the list — note that you can execute this task anywhere on your spreadsheet, as you’ll tell the program exactly which cells it’s looking for. You can produce a working example by typing in =SUM(E1:E5), but there are other ways to relay this command, too.
You might want to enter in the word SUM and open the brackets, then select the cells manually. You can do this by holding down Control key and clicking individual cells — dragging over multiple cells works also. Alternatively, you can type in individual cell references separated by a single comma if they’re not sequential.
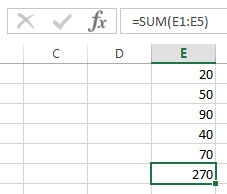
The benefit of using cell references in Functions rather than integers is that your results will update based on the contents of those cells. Once your spreadsheet projects begin to get more complex, this will certainly come in useful.
In recent years, Excel has grown into a powerful tool for creating dashboards as well as conventional spreadsheets. Creating a dashboard in Excel can reap great benefits, but can also take a lot of effort depending on your needs — however, conditional formatting can add an element of the dashboard experience to a standard spreadsheet, and is very easy to put in place.
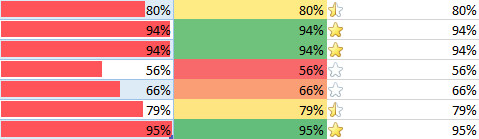
For these purposes, we’ll use conditional formatting to help provide a visual shorthand for some data, so pick something that’s worth being able to assess at-a-glance if you’re going to try this one out. Select that data, and navigate to Home > Conditional Formatting.
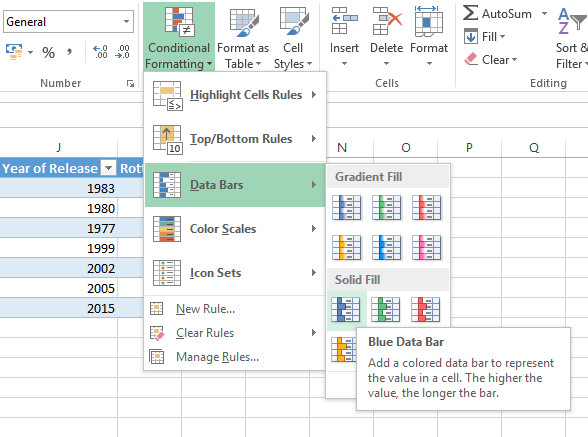
You’ll fine a great wealth of different formatting options. We’re looking at percentages, so a data bar makes sense — however, color scales and icon sets can also be used very effectively in appropriate circumstances.
Remember that you can control aspects of the process by clicking on More Rules in the dropdown menu. If your formatting isn’t providing enough differentiation to be immediately clear, consider tweaking the rules a bit.
Anyone can create a chart with Excel — the secret to becoming an expert is being aware of all the many tools the software offers to make a chart that fits your brief perfectly. A trendline is one of the many components that you might need to bring together to achieve that task.
This is an addition that you’ll make to a chart once it’s been built, so create one as a test or use something that’s already been prepared. Once it’s in place, you need to click on the chart, then click the Chart Elements shortcut that’s illustrated by a plus sign icon. You can add a trendline quickly by checking the box next to it, or you can click on the arrow to the right to access more detailed options.
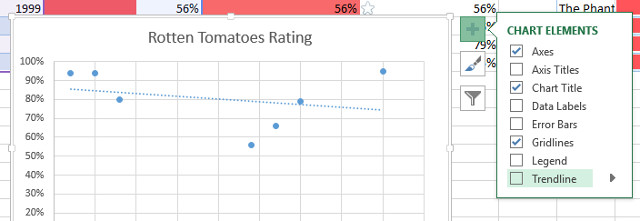
The crucial element here is to know what you’re trying to illustrate. A trendline isn’t a good addition in many situations, so it’s vital that you think about the data that you’re trying to present, and consider whether you’re adding something worthwhile to your chart, or just introducing more clutter that distracts from the point being made.
There’s always more to learn about Excel, but here are a few good places to start. Microsoft’s Office Support site is home to a bevy of clearly presented tutorials on everything from high-level usage to the simplest tasks you might want to carry out.
Alternatively, Excel Functions provides a great reference point, whether you’re an absolute beginner or a seasoned veteran. Of course, Excel will help you out with tooltips as you try input a Function, but it’s good to have such a comprehensive resource to hand, if you do end up in a bind.
Finally, there’s a host of great Excel tutorials to work your way through on MakeUseOf. You can learn how to use the software to get the most out of your family budget, see classic video games recreated entirely within the program, or even take your data analysis to the next level by learning to use Power BI in conjuction with Excel.
Do you have a question about your next steps to Excel mastery? Or are you a seasoned user looking to share your wisdom with the next generation? Join the conversation in the comments section below.


 Want to Try Tabletop RPGs? Learn the Ropes with Online Tabletops!
 Star Wars Battlefront: All Diorama Figurines and How to Get Them
 CoD: Black Ops III Guide On How To Unlock Max Levels, Guns, Perks & More
 How to Unlock Secret Fighters in Soul Calibur V
 Deception 4: The Nightmare Princess PS VITA review